Telemetry has always allowed you to tag and track individual allocations using the tmAlloc/tmFree APIs, however this is often overkill (tracking all allocations); noisy (lots of stuff tracked we don't care about); expensive (lots of data); tedious (lots of markup); and in the end, hard to parse (no clear structure to visualize over time). It's still the right low-level API since it puts the control in the programmer's hands, but a cleaner mechanism on top of that has always been desirable but hard to define.
Telemetry 2 is looking to provide that using an experimental new feature called memory zones. These are just normal Telemetry zones with a new flag attached to them, TMZF_MEM_REGION_EXPERIMENTAL. Specially annotated allocations that occur inside this zone are logically grouped and plotted (for now, the individual memory intervals are still recorded so that we can do more analysis later if we choose).
void MyFunc()
{
tmZone( cx, TMZF_MEM_REGION_EXPERIMENTAL, "MyFunc" );
...
foo* f = new foo;
//note the empty description!
tmAlloc( cx, f, sizeof(*f), "" );
//note the empty description!
bar* b = new bar;
tmAlloc( cx, b, sizeof(*b), "" );
...
delete b;
delete f;
}
With the above code snippet, 'f' and 'b' would contribute to the 'MyFunc' bucket. While useful, where it really starts to help is when you overload operators new and delete to take advantage of this:
void *operator new( size_t s )
{
void *p = malloc( s );
// empty description means 'use mem zone'
tmAlloc( cx, p, s, "" );
return p;
}
Then we can remove the tmAlloc calls from MyFunc:
void MyFunc()
{
tmZone( cx, TMZF_MEM_REGION_EXPERIMENTAL, "MyFunc" );
...
foo* f = new foo;
bar* b = new bar;
std::vector< foo > v;
v.push_back(*f);
...
delete b;
delete f;
}
What happens now is that when 'foo' and 'bar' are allocated, our overloaded operator new will be within the MyFunc memory zone and accounted for properly. Not only that, but any memory allocations trapped by our overloaded operator new (such as implicit ones by STL) are gathered as well, so in the above case any incidental allocations that result from manipulating the vector will be accounted for automatically.
In practice this means that you can now progressively mark up memory allocations exactly the same way you do with zones. In fact, Telemetry will discard allocation and free events with empty descriptors if they're outside of a mem zone, which reduces overhead considerably:
void MyFunc()
{
tmEnter( cx, TMZF_MEM_REGION_EXPERIMENTAL, "tracked" );
p = new P(); // overloaded operator new traps and tracks
q = new Q(); // overloaded operator new traps and tracks
tmLeave( cx );
r = new R(); // ignored on server (outside mem regions!)
}
The brute force option to get up and running would be to enclose a giant memory zone around your application's main() function. While this would work, it would be a lot of traffic and, as a result, somewhat meaningless until you add more memory zones (the full hierarchy is preserved so more zones = more detail).
A less intensive approach would be to progressively annotate "leafy" pieces of code and work upwards from there. For example, start with your audio system or your level loader, see what it looks like, then go back and adjust your markup, try it again, etc. This is very analogous to how zone markup is usually done with Telemetry.
What does this buy you? Well, you have a nice clean way of discarding/ignoring memory allocations for starters, which can help keep traffic and total data storage requirements under control.
Second, you gain automatic plotting of memory usage by memory zone. This lets you look at memory usage at a high level then, if necessary, zoom into areas of interest and look at individual memory allocations.
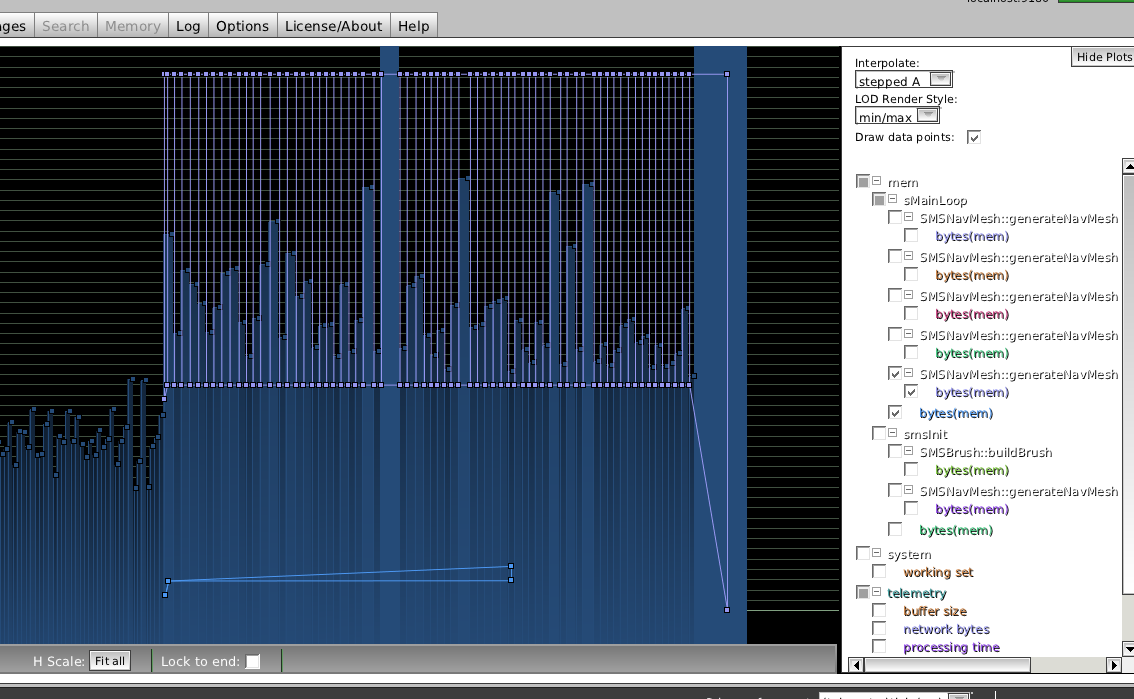 |
| Plots showing memory usage of sMainLoop |
 |
| Zoomed in we can see usage pattern in more detail |
 |
| Individual memory intervals are still visible |
Finally, we'll add a bunch of visualization features so that we can take advantage of this system, which is really what we and our customers want!
No comments:
Post a Comment